xBit v4.1.9 Release Notes
September 28, 2026
Feature Highlight: Build Your Own Case Stats
Your lab's data. Your questions. Answered in seconds.
Every lab runs on questions. Are we keeping up? Where is the backlog building? Who is carrying the load? What is costing us the most? Until now, Case Stats and Evidence Stats answered the questions we chose for you.
Now they answer yours.
Build any chart you can think of in a single form, watch it take shape live as you work, and click straight through from a slice of the chart to the exact cases behind it. No exports, no spreadsheets, no waiting on someone else to run a report.
✨ What's new
| Feature | Description |
|---|---|
| 🛠️ Build a chart in one form | Choose fields and see a live preview. |
| 📚 Chart Library | Add any of 43 ready-made charts. |
| 🔗 Linked charts | Select a slice to filter its linked chart. |
| 🔍 Drill down | Open matching cases in Stats Explorer. |
| 📈 Trends over time | Switch between day, week, month and year. |
| ⬇️ Share the numbers | Download an image or CSV, or copy as HTML. |
📚 Start from the Chart Library
Don't want to start from scratch? Stats > Chart Library puts 43 ready-made
charts at your fingertips, each named for the question it answers:
- ARE WE KEEPING UP?
- BACKLOG AGING
- WHAT'S SLOW
- TURNAROUND vs TARGET
- WHO WE SPEND ON
Browse by subject (People, Status & deadlines, Time & age, Volume & throughput, Tools & OS, and more) or search for what you need. Click Add to Case Stats or Add to Evidence Stats, and it's on your page. Each card shows whether you already have it, so your dashboard stays clean.
🛠️ Create your own chart, exactly the way you need it
Go to Stats > Case Stats (or Evidence Stats) and click Add Chart.
Build your first chart in under a minute
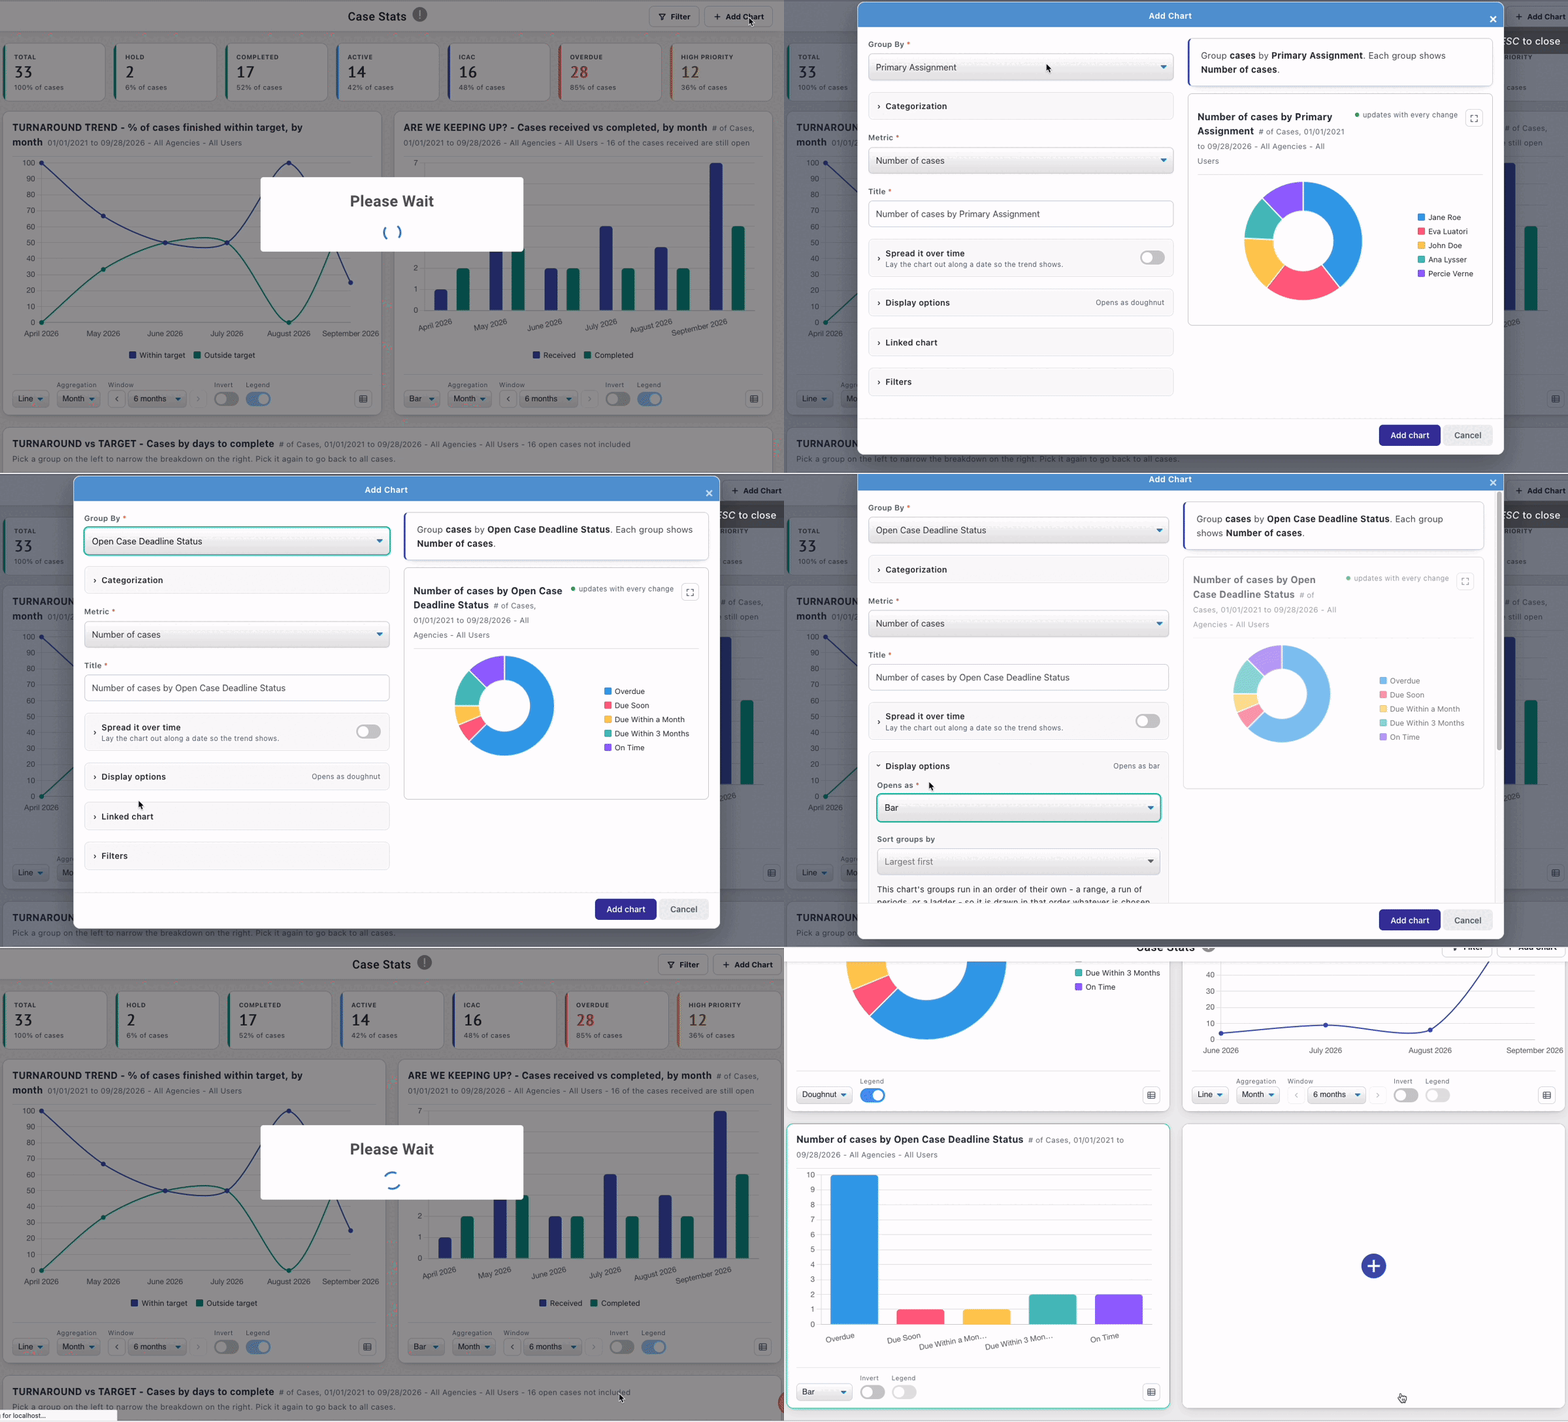
- Go to
Stats>Case Stats. - Click
Add Chart. - Set Group By to Case Status and Metric to Number of cases.
- Watch the preview come to life, then click
Add chart.
Your new chart appears at the bottom of the page, highlighted and ready to use.
Then keep going. Every question your lab has been asking is now a chart away.
As you build, the form reads your chart back to you as a plain-English sentence, so there is never any doubt about what it will show:
Group cases by Primary Assignment. Each group shows Number of evidence items.
Right beside it, a live preview draws the real chart from your real data and redraws with every change. What you see is exactly what you get.
Group by anything that matters to your lab
The Group By list reaches across your whole operation:
- Case Assignment: Primary Assignment, and how well it's covered
- Case Classification: Case Status, Open Case Deadline Status (Overdue, Due Soon, On Time…), Required by reason
- Evidence Assignment: Assigned To, Triaged, Imaged, Completion
- Evidence Classification: Evidence Type, Forensic Software, Operating System, Legal Order Type, Advanced Method
- Flow over time: Received vs completed, the single clearest answer to "is the lab keeping up?"
- Your own form fields: any field in your case forms, e.g. Case Information > Requester
- Several fields together: fold multiple fields into one set of slices
Measure what you're accountable for
Choose a Metric — a count, a total, or an age:
- Count: number of cases, % of cases, evidence items (all, completed or active)
- Total: expenses, memo hours, forensic tool hours, or any number field on your form
- Age & turnaround: oldest, average and median age or completion time, in days
- Per-item averages: expenses or hours per case or per evidence item
From caseload to cost to turnaround, the numbers leadership asks for are a few clicks away.
Categorization: Group values the way your lab thinks
Categorization lets you rename values, combine them into one group, or organize free-form text, numbers and dates. Add rules such as Matching selection, Contains, Range or date comparisons, then choose the label shown on the chart. Rules with the same label combine; Everything else groups unmatched values. Text and date fields need at least one rule to create useful groups.
📈 See the trend, not just the snapshot
Turn on Spread it over time and choose a date: request, completion, deadline, evidence triaged or imaged, expense, memo, and more. Viewers switch freely between Raw, Day, Week, Month and Year, and step back and forward through earlier and later periods to see where things are heading.
Focus on exactly the right cases
Add Filters so a chart counts only what you care about. Conditions on the
same field combine with OR; conditions on different fields must all match. Filtered
charts carry a corner marker, so anyone viewing knows precisely what they're
looking at. No hidden assumptions, no misread numbers.
Make it presentation-ready
In Display options, choose:
- how the chart opens: Bar, Line, Doughnut, Pie or Polar area
- how groups are sorted
- where the legend sits
- whether bars run horizontally
- whether labels show percentages
The title writes itself and keeps pace with every change. Prefer your own wording? Type it in — and if your title ever drifts out of step with what the chart shows, xBit tells you.
💡 Tip: Have a chart that's almost right? Open
More actions>Copy chart. The form opens fully filled in, and nothing you change touches the original.
🔗 Charts that talk to each other
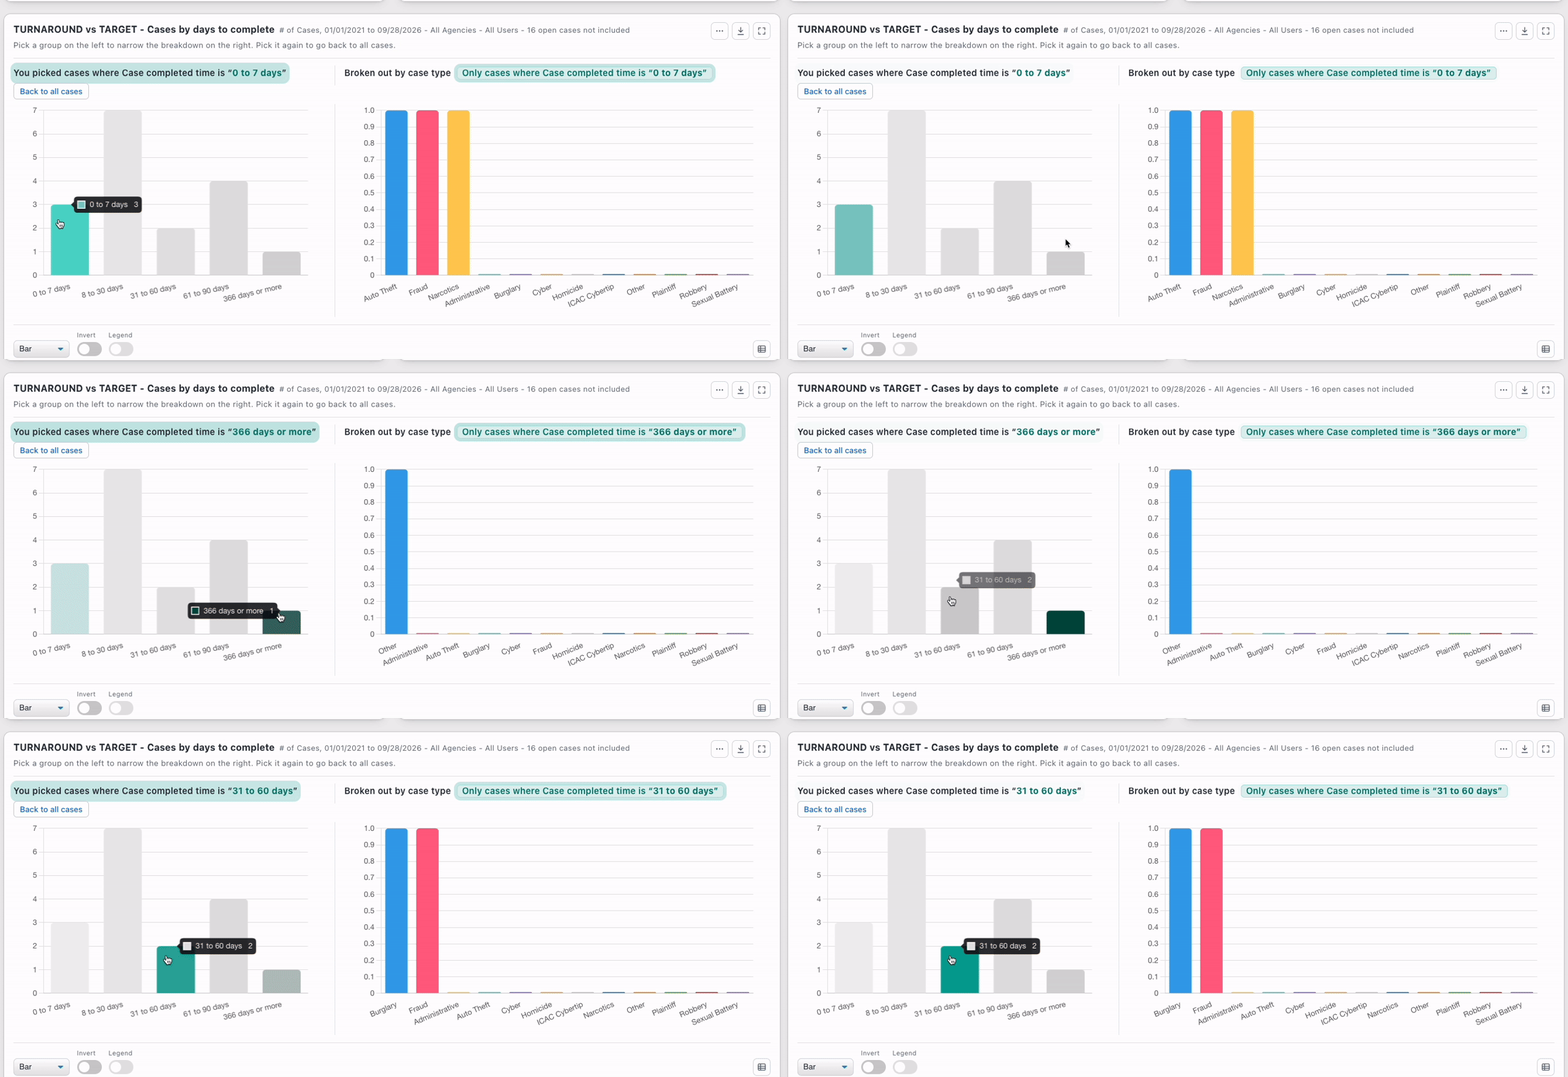
Give a chart a Linked chart to see the same data from a second angle. Click a
slice on the first chart and the linked chart narrows to match, instantly:
You picked ICAC cases where Case Type is "Child Exploitation" — Back to all cases
Click the slice again, or Back to all, to return to the full picture. Two charts become one interactive investigation.
🔍 From chart to case in one click
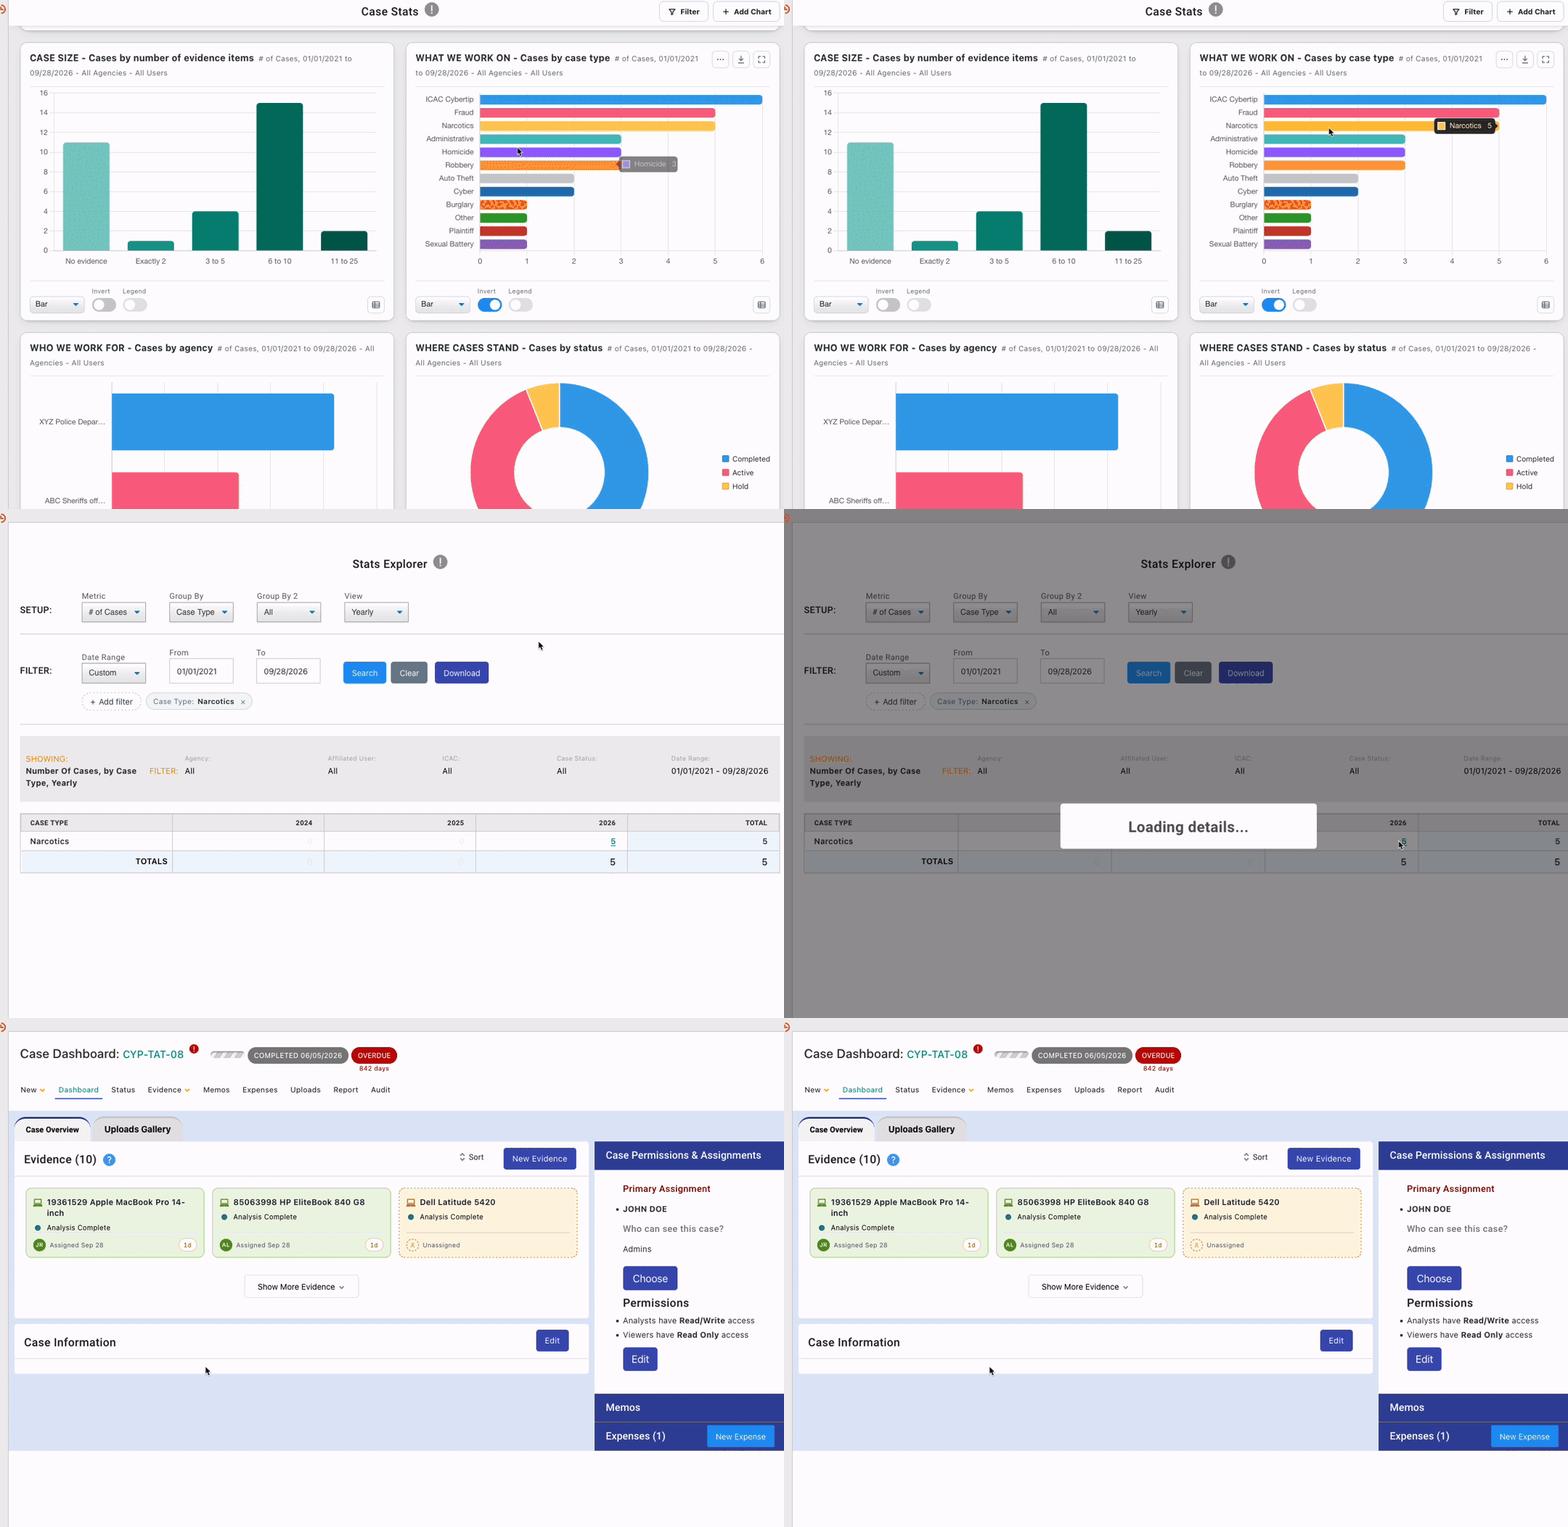
A chart shouldn't be a dead end. Click any slice or bar and Stats Explorer opens on exactly that group, with the chart's filters and the page's filters carried along. From there, share the search, download it as a spreadsheet, or save it to My Reports. The path from "that number looks high" to "here are the cases" is one click long.
🎯 Built for the way labs actually work
- Clear, even with many groups. The 12 biggest groups are shown and the rest are combined into Everything else. One click on Show all groups reveals every one.
- Every viewer gets their view. Anyone can switch a chart between types, and legend entries they hide stay hidden next time they visit.
- Missing data is shown, never hidden. Not selected, N/A and Unassigned are drawn in grey at the end of the chart, and the subtitle states how many rows were left out. Gaps in your data are something to see, not something to discover later.
- Tooltips that tell you what you're looking at. Hover a slice for its name and value; hover a title for an explanation of what the chart shows.
- Fully keyboard accessible. Tab through slices and legend entries, and press Enter to open one.
- System charts are protected. Built-in charts carry a
Systembadge and can only be changed by an administrator — who can Reset to original or Restore a deleted one at any time.
🚀 Other New Features
Case Memos
- The Case Memo list is now sortable: click any column header to sort ascending, click again for descending, with the active column and direction clearly indicated.
Report Builder
- All case fields are now available when adding fields to Custom Content and Rich Text Fields, not just Case ID and Case Type.
User Management
- When SMTP is enabled, admins creating a new user can now choose to set the user's password right away or email the user instructions to set it up themselves.
🐛 Bug Fixes
Login & Sessions
- After a session expires and the user signs back in, xBit now returns them to the exact evidence or case page (including the tab) they were on, instead of an errored page.
- Fixed the next login after a logout sometimes landing on a raw Table View data response instead of a page.
User Management
- Fixed the Users page taking minutes to load, timing out, and making the whole instance unresponsive for everyone while it loaded.
Report Builder
- Fixed the breadcrumb showing an internal translation key instead of the report name after editing the Lab Submission Receipt.
- Fixed the Rich Text Editor not opening when adding a second Rich Text Field in the same row of a Content Library block.
- Fixed the Content Library "Unsaved Changes" prompt showing raw placeholder text instead of the formatted message.
- Fixed the Case Type field not populating on the Lab Submission Receipt.
Case Reports
- Fixed case report PDF generation failing when "Embed PDF Documents" is selected and a case contains a very large, high-page-count PDF attachment.
Case Memos & Request Manager
- Memo lists, generated case and evidence reports, and Request Manager widgets now order items by their actual date (e.g. Entry Date) rather than the order they were created, so backdated memos appear in the right place.
Lab Submission
- Fixed an "Error Saving Evidence" failure when adding evidence to a Request Submission whose evidence form includes a Reference Exhibit field.
USSS FPR
- The Exam Start Date is no longer reset to today whenever new evidence is added to an existing case, so FPR exports keep the original start date.
Form Builder
- Fixed Form Builder failing to open on installs that use the legacy Evidence Type field type.
Deadlines
- Fixed deadlines displaying a negative number.
🌈 UI Changes
Review Manager
- Toggling Start/Stop Peer Review or Admin Review no longer reloads the whole page.
Evidence Cards
- Reference Exhibits in the evidence hover card now line up correctly, show the exhibit's display name instead of its internal ID, and link directly to the referenced evidence.
User Management
- The New User form no longer shows a premature "Invalid Password" message when SMTP is enabled, and now displays a loading indicator while the new user is being saved.