Case and Evidence Stats
Case Stats and Evidence Stats turn your lab's data into charts that answer the questions you care about: whether the lab is keeping up, where the backlog is building, who is carrying the load, and what is costing the most. Open them from Stats > Case Stats or Stats > Evidence Stats.
Each page comes with built-in charts, and you can add your own from the Chart Library or build one from scratch.
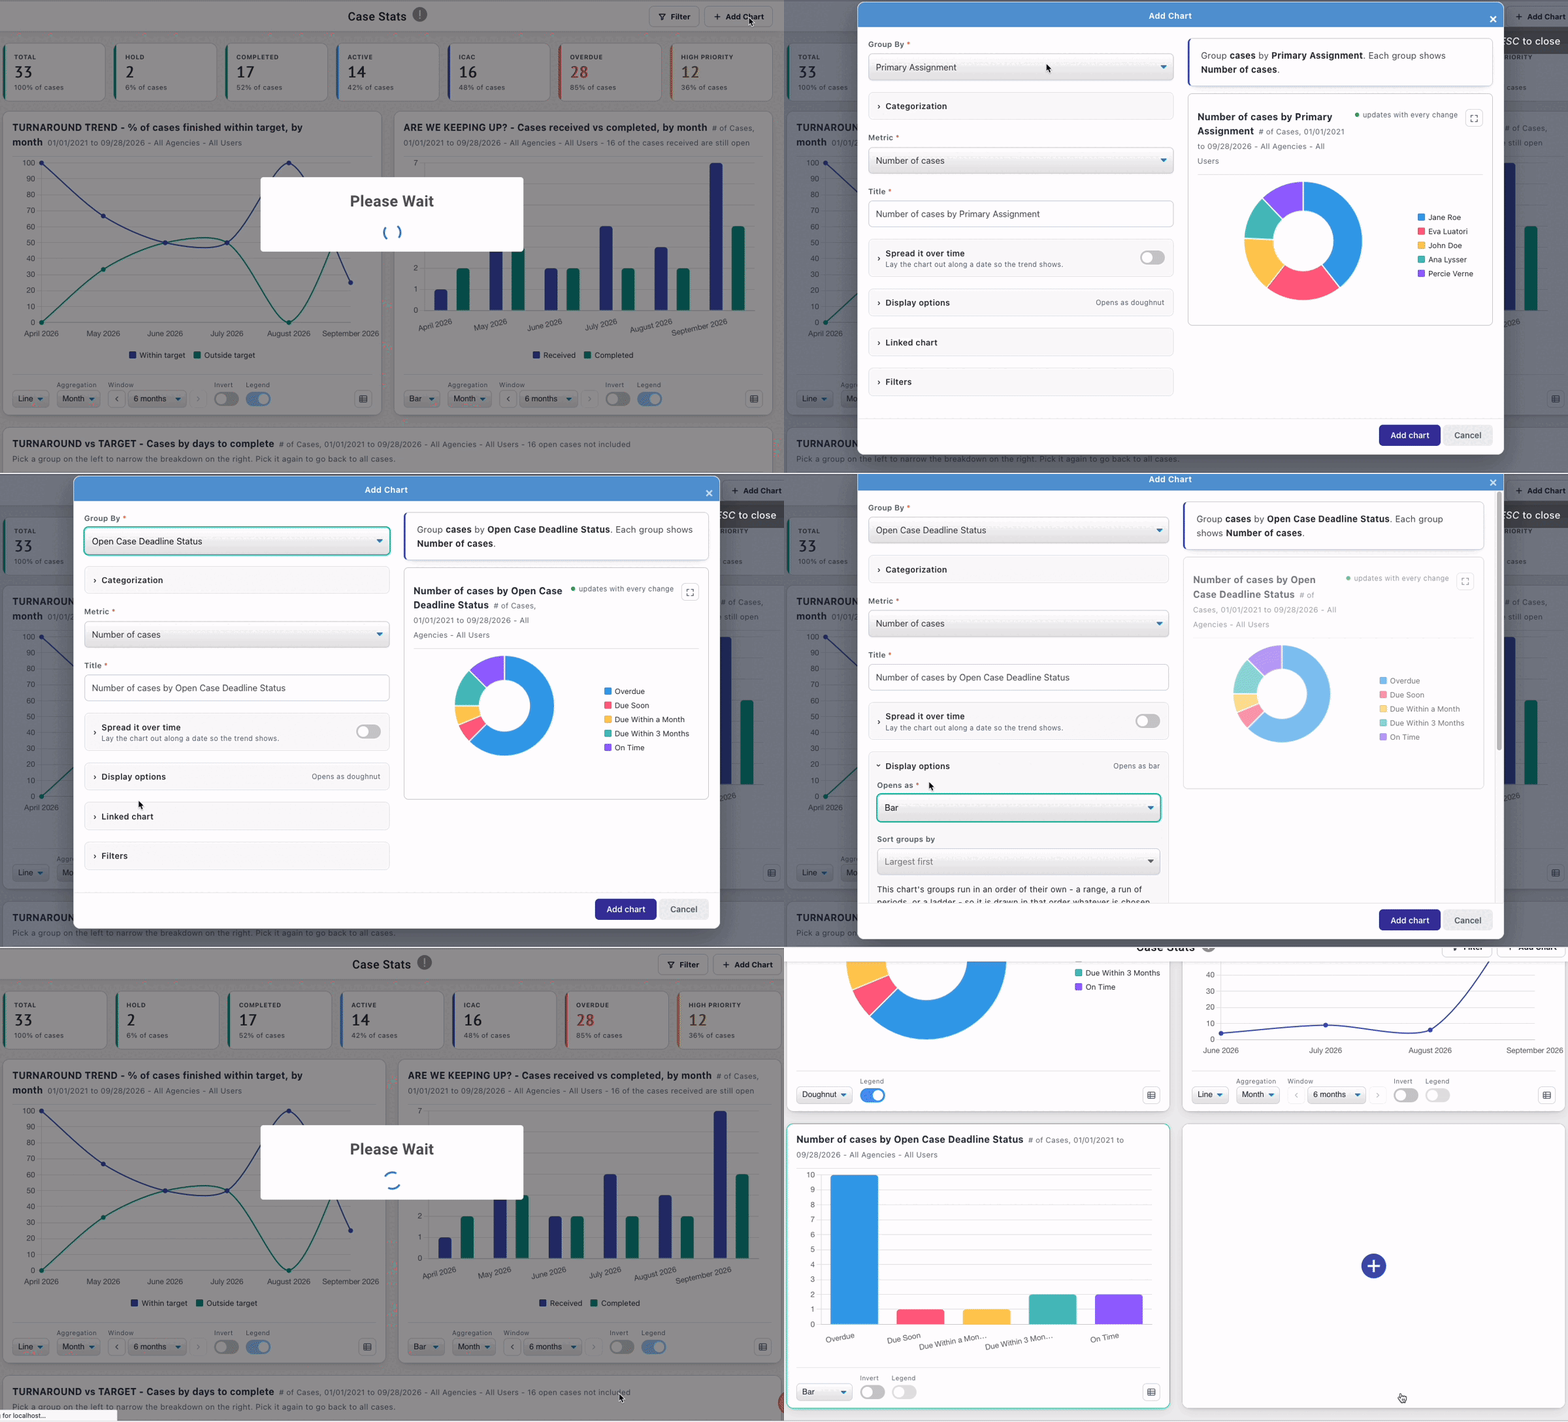
Add a chart from the Chart Library
Stats > Chart Library has 43 ready-made charts, each named for the question it answers, such as ARE WE KEEPING UP?, BACKLOG AGING, WHAT'S SLOW, TURNAROUND vs TARGET and WHO WE SPEND ON.
- Browse by subject (People, Status & deadlines, Time & age, Volume & throughput, Tools & OS, and more) or search for a chart.
- Click Add to Case Stats or Add to Evidence Stats.
Each card shows whether the chart is already on your page.
Build your own chart
- Go to
Stats>Case Stats(orEvidence Stats). - Click
Add Chart. - Choose a Group By field and a Metric. For example, set Group By to Case Status and Metric to Number of cases.
- Adjust the optional settings described below.
- Click
Add chart.
The new chart appears at the bottom of the page, highlighted.
As you build, the form describes the chart in a plain-English sentence, for example:
Group cases by Primary Assignment. Each group shows Number of evidence items.
A live preview beside the form draws the chart from your data and updates with every change.
💡 Tip: To start from an existing chart, open
More actions>Copy chart. The form opens filled in with that chart's settings, and your changes don't affect the original.
Group By
Choose what each slice or bar represents:
- Case Assignment: Primary Assignment, and how well it's covered
- Case Classification: Case Status, Open Case Deadline Status (Overdue, Due Soon, On Time…), Required by reason
- Evidence Assignment: Assigned To, Triaged, Imaged, Completion
- Evidence Classification: Evidence Type, Forensic Software, Operating System, Legal Order Type, Advanced Method
- Flow over time: Received vs completed
- Your own form fields: any field in your case forms, e.g. Case Information > Requester
- Several fields together: combine multiple fields into one set of slices
Metric
Choose what each group measures:
- Count: number of cases, % of cases, evidence items (all, completed or active)
- Total: expenses, memo hours, forensic tool hours, or any number field on your form
- Age & turnaround: oldest, average and median age or completion time, in days
- Per-item averages: expenses or hours per case or per evidence item
Categorization
Categorization lets you rename values, combine them into one group, or organize free-form text, numbers and dates.
- Add rules such as Matching selection, Contains, Range or date comparisons, then choose the label shown on the chart.
- Rules with the same label are combined into one group.
- Everything else collects values that don't match any rule.
- Text and date fields need at least one rule to create useful groups.
Spread it over time
Turn on Spread it over time and choose a date, such as request, completion, deadline, evidence triaged or imaged, expense or memo date. Viewers can switch between Raw, Day, Week, Month and Year, and step back and forward through earlier and later periods.
Filters
Add Filters so a chart only counts the cases or evidence you care about.
- Conditions on the same field are combined with OR.
- Conditions on different fields must all match.
Filtered charts show a marker in the corner so viewers know the chart is filtered.
Display options
In Display options, choose:
- the chart type it opens as: Bar, Line, Doughnut, Pie or Polar area
- how groups are sorted
- where the legend sits
- whether bars run horizontally
- whether labels show percentages
The chart title is written for you and updates as you change the chart. You can type your own title instead; if it no longer matches what the chart shows, xBit warns you.
Linked charts
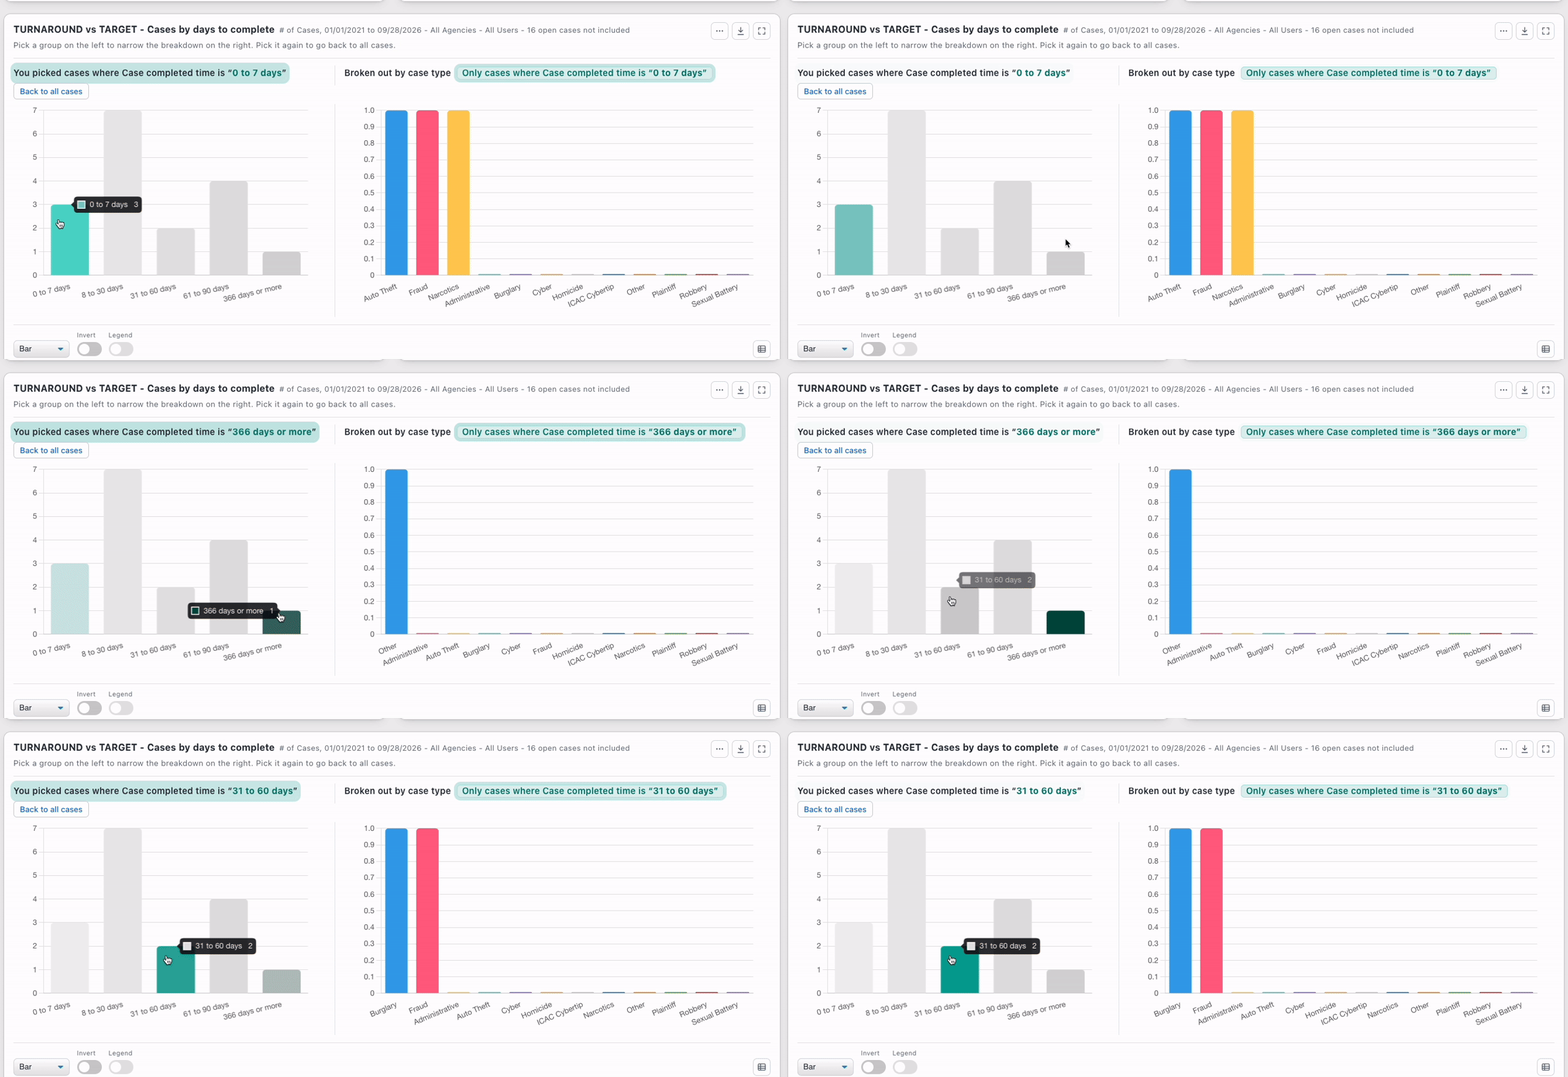
Give a chart a Linked chart to see the same data from a second angle. Click a slice on the first chart and the linked chart narrows to match:
You picked ICAC cases where Case Type is "Child Exploitation" — Back to all cases
Click the slice again, or Back to all, to return to the full data.
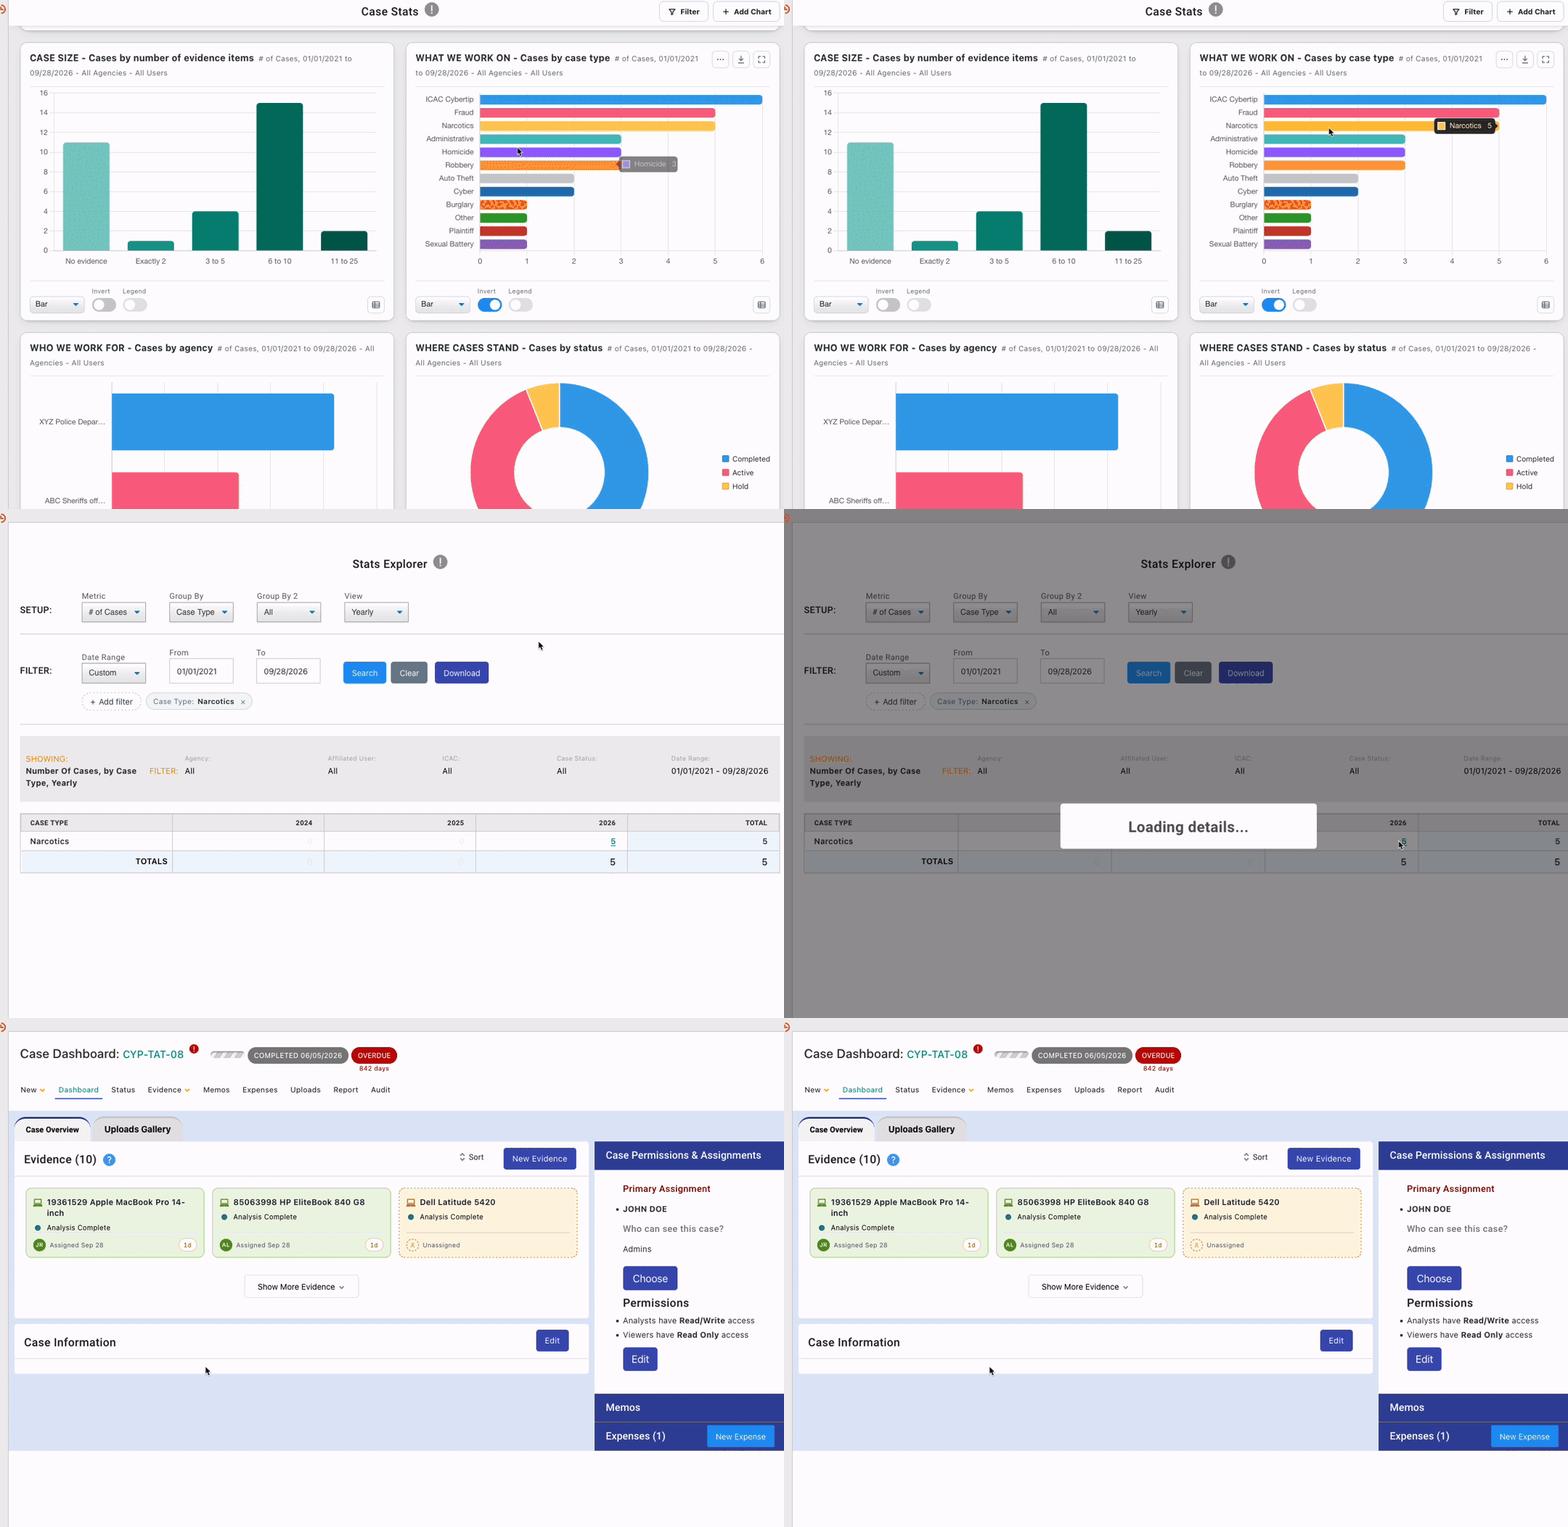
Drill down to the cases behind a chart
Click any slice or bar to open Stats Explorer on exactly that group. The chart's filters and the page's filters are carried over. From there you can share the search, download it as a spreadsheet, or save it to My Reports.
Viewing and sharing charts
- Switch chart types: any viewer can switch a chart between types. Legend entries you hide stay hidden the next time you visit.
- Chart actions: expand a chart to Fullscreen, switch to Table View to see the underlying numbers, or show the Legend.
- Share the numbers: download a chart as an image or CSV, or copy it as HTML.
- Many groups: the 12 largest groups are shown and the rest are combined into Everything else. Click Show all groups to see every group.
- Missing data: Not selected, N/A and Unassigned are shown in grey at the end of the chart, and the subtitle says how many rows were left out.
- Tooltips: hover a slice for its name and value, or hover a title for a description of the chart.
- Keyboard access: press Tab to move through slices and legend entries, and Enter to open one.
System charts
Built-in charts carry a System badge and can only be changed by an administrator. Administrators can Reset to original a changed system chart, or Restore one that was deleted.