Stats Explorer
- Open Stats Explorer from the reporting or analytics area of the app.
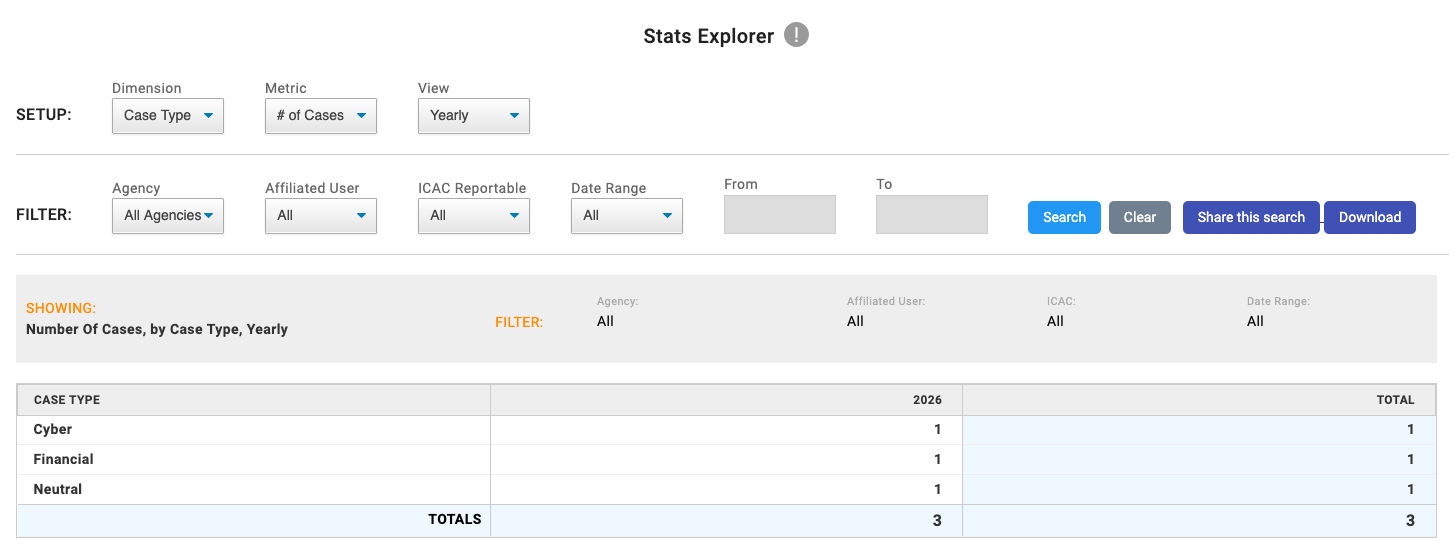
- In the first dropdown, choose a Dimension to group the results by, such as a standard field or a custom field.
- In the second dropdown, choose a Metric to measure, such as counts or number-based values.
- Apply any available filters, such as date range, user, agency, or other field-based filters, to narrow the results.
- Review the generated chart or table to compare values across the selected dimension.
- If needed, export the results using the CSV download option.
Notes
- If you create a dropdown (in form builder) it will automatically be added to your Stats Explorer “Dimension” dropdown option.
- If you create a field that captures a number (Integer or decimal) it will automatically be added to the “Metric” dropdown. These allow you to create your own unique stats.
- The Volume metric is only shown when USSS is enabled.